Wednesday, December 31, 2014

Small caps are giving me butterflies! RUT

Happy New Year Traders!

After the FED inspired exuberance in the last half of the month of December, I felt I should get a little short.


 To act on this, I entered an Unbalanced Broken wing Butterfly in Russell 2000 index options (RUT).


This is a way for me to short RUT with some upside protection. For February 20 expiration, I bought one 1250 call, sold 3 1270 calls, and bought 2 1350 calls to define my risk. The short calls are sold at about 5% higher than where RUT is trading currently. The spread was sold for a net credit of $10.15.

I sold the spread for a pretty nice credit, but 50 days to expiration is pretty far away. I think that it is in the realm of possibility that RUT could very well move up that 5% before expiration.

One of the reasons that I like Broken Wing Butterflies, and more particularly the unbalanced kind, is that if I'm wrong, and RUT expires at the 1270 strike, the net credit on expiration will be in the neighborhood of $25.00. This far exceeds my income expectation on this trade and would be a bonus. The worst case scenario for this structure is if RUT runs up 5% very quickly in the new year. The expiration break even is 1285 for this particular butterfly, and if that level is touched, I will close the trade.
 
Ok, so looking at the P&L chart above, it could cost as much as $32.00 to close the Unbalanced Broken wing Butterfly at 1285 before expiration. This is more risk than I am willing to bear. Enter the hedge: An out of the money butterfly in RUT.


I spent quite a while trying to find call debit spread structures in IWM, the Russell 2000 ETF, that satisfied the purpose of a hedge, and I couldn't find one. I was initially wanting to use IWM, because if I came up with a structure that used the same strikes as the trade above, I would still be able to enter. What I ended up settling for as my hedge is the 1260/1280/1300 call butterfly expiring in February monthly cycle. If my short term negative opinion on RUT doesn't play out I am going to buy 2 butterflies to hedge my UBWB. If RUT blasts off 5% these butterflies will allow me to close at 1285 with much lower losses than I other wise would be able to.

So, here's the skinny. If RUT is weak when it opens on the 2nd of January, I will just close the UBWB if I can close at $4.85 or better. If not, I will buy the OTM Butterfly hedge, and I will be in the trade for the long haul. The UBWB is a negative delta trade that benefits most when RUT declines. The double edge on that sword is that the UBWB can go far in the red very quickly to the upside. The purpose of the hedge is to nullify that delta somewhat without giving up the income side of the trade.

If you have any questions or comments, don't hesitate to ask in a comment below.

I will update the status of the trade here periodically. Follow me on Twitter @B50cal1978 as I post updates there as well. Don't be afraid to check out my sponsors below and to the right.

Wishing all of you and your families the best in the New Year!

STT

Saturday, December 20, 2014

Damsel in Distress! RSX

Good Day Traders,

What an interesting week. WTI Crude dropped and then bounced into the end of the week. There was a continuation of the collapse in the Russian Ruble, and then the FED came in and blasted every index short out of the water.

In the midst of all this, I found myself at the end of the week positive in all of my short index volatility positions, and I was able to close a long trade in RSX. I am still inside out on my short position in Oil volatility via OVX, but I still have time for those to play out.

As for RSX, I had a trade earlier in the year that I though I would take a shot at repeating.

Mother Russia is my Damsel in Distress.


Above is a one year chart of RSX. The highlighted area is from March of this year. What prompted me at the time to want to take a long position in a down trend, was that the collapse of the Russian stock market at the time became a front page news story in non-financial media. I took a small long position by selling a put spread to buy calls. I was able to close the trade a couple of days later with a profit.

Fast forward to November... Whenever financial stories become part of the approved AP drivel that's allowed to be discussed in mass media, I get curious. It seems that nobody is better than calling a bottom in securities than ABC.


After this last severe downdraft, concurrent with the slide in the price of crude oil, the Russian economy again became approved by the AP as a disaster story drama piece for American consumption. Here's How I played it:


I sold a put spread far out of the money to finance the purchase of an at the money call. I did not know for sure when the bounce would come, but I was pretty sure that it would. I entered the trade with the options expiring in 13 months on January of 2016. There was a ton of liquidity the night I placed the trade, even in the LEAPs. I placed the trade on a single entry ticket to reduce commissions and because the spread combined on all three legs of the trade was around $.05. I got filled 2 cents below mid prices the second I clicked the mouse.

My primary risk management in this trade is duration. I had 13 months to be right, I just chose to close it in three days. The trade concept is entirely speculative based on anecdotes in mass media. The execution is based on what looked like capitulation to me on December 15 on the RSX chart, characterized by 2.5 times the average volume, and the gap down over the previous session.

So in summary, Long RSX for $1.80 on 15 December, closed for $3.40 on 18 December, thus rescuing my Damsel in Distress.

Good luck trading next week to everybody, and happy holidays to you and your families.
STT

Friday, December 5, 2014

Why you gotta be so Crude?

Good Morning Traders,

In my eternal search for volatility to sell, the extreme move down in crude oil futures and related products has not gone unnoticed. Over the last week or so, I've been going through different ways to capitalize on a decline in Crude Oil volatility as the holidays approach, and into the new year. I looked into different possibilities with USO and I couldn't find a trade that worked for me because of the very low price of the USO ETF currently. I have been surfing the CBOE Options Hub lately, and now I have a plan.

My basic thesis is that current implied volatility in the USO is way higher than historical norms, and that volatility will abate in the coming months creating an opportunity to profit from this anticipated decline.


Behold the OVX. In short, his is a volatility index that seeks to track the volatility of the USO ETF. The options on OVX are cash settled, European style options. This is a benefit to me over USO because there is no risk of early assignment if things don't go my way.

My plan is to sell a 32.5/42.5 call credit spread in OVX in the February 2015 expiration cycle. I am shooting for a credit of $2.40. The total risk on this trade would be $7.60, and my break even level at expiration would be at $34.90 in the OVX. I am choosing the February cycle because if I am wrong, I have a whole lot of time to adjust, roll or otherwise manage the capital involved.


Drop comments or questions if you so desire. I will update the progress of this trade and my others as they are filled or closed.

Good Luck!
STT


Thursday, December 4, 2014

All That Glitters is Gold. GLD

Good Morning traders,

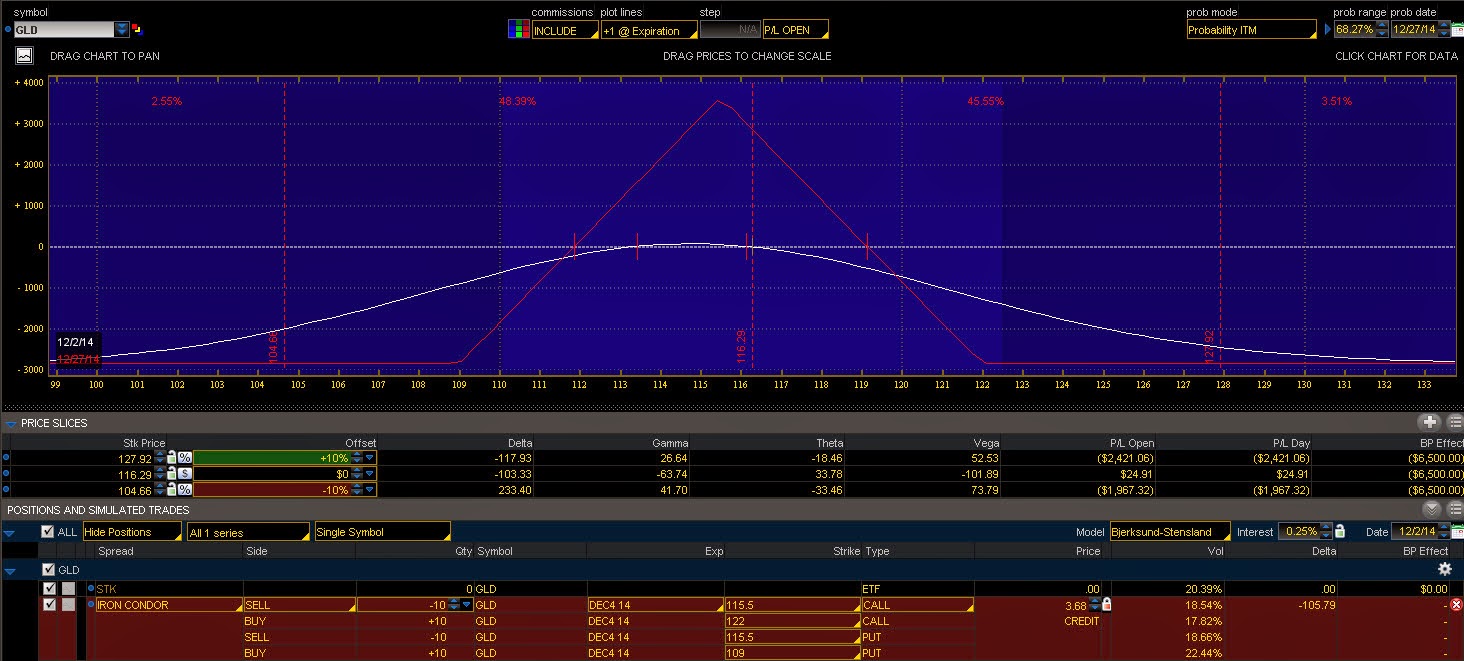
With this crazy rally off of the "V" bottom in the indexes, it has been a little difficult for me to find volatility to sell in the normal places I look. For most of my monthly income trades I use SPX options about 45 days out from expiration, usually placing a 10 Delta Iron Condor. With the VIX below 12, I am uncomfortable placing the put side because of how far and how fast these condors can go into the negative on even small moves down in the SPX. What I've done this month for the January expiration cycle, I've sold a 2150/2200 call spread in SPX for $3.15 at about a 20 Delta. My plan is to sell the second half of the Iron Condor before 9 Dec 2014 if I see a VIX print above 15. If not, I'll take profits on the call spread at %50 of max credit, and try again next month.

Here's what the above spread looks like:


Here's a post from Dana Lyons about "V" bottoms providing some context to the market we're in.


In an effort to find volatility to sell to keep my income goals on track, I went back into the play book for a trade that I made money on earlier in the year, and that I was reminded of by Dan Sheridan from one of his recent Youtube posts, an Iron Butterfly in GLD.


I sold this Iron Butterfly for $3.68, centered on the 115.50 strike expiring 26 Dec 2014. My target is 25% of max credit or $.92 by a pre-placed limit order. If I get anywhere close to the expiration break even points at 112 or 119, I will close and take the loss. If I am awake (I live in Japan) and I am up more than $.58, I will manually close and take profits at that point. I want to be out of the trade ASAP.

 
While the implied volatility at the time of sale was high compared to historical volatility, thus providing a high credit, the recent propensity of GLD to swing wildly is also the greatest risk in this trade. Though the options expire on the 26th of December, I ideally want to be out of the trade in 7 days or less. The Vega for the trade as I type is -98, and the Theta 33. I am looking for volatility to contract to get me out as early as I can.

If you took the time to read this far, please drop a comment or a question. I enjoy questions and engagement from other traders who do these kinds of spreads or are trying to learn.

Thanks for your time,
STT


Friday, November 28, 2014

Back in business 2 NDX USD/CAD

I can't believe it's been since March that I posted!

I've been busy. Pics to follow in later posts.

Anyway, I have a couple of trades to post. One, a USD/CAD long that finished much quicker than I thought that it would. Also, with the indexes looking a little overbought, I was going through the playbook to try to find a way to go short the NDX in a way that with my limited capital that I would be able to take advantage of. Using the QQQ for selling a credit spread to the upside, or a speculative butterfly to the downside seemed prohibitive as far as commissions go. Once you get over 10 contracts or so, it can cost more than $40 to open or close a trade.

I almost never let an options trade go to expiration. Instead, at the beginning of the trade, I define the amount of profit that I intend to make, and the amount that I will accept losing. Often, this depends on the structure of the spread. On longer term iron condors or other credit spreads, I'll try to pull 50% profit on the credit generated at the outset of the trade. On shorter term trades, I'll try to get 10 to 15% off the capital at risk, and I will close the trade if it dips that far into the negative during the course of the trade.

Since I'm on the subject of options, I'll post the NDX trade I just opened last night.

 
It's a ratio spread of sorts that expires on 17 January 2014, or 48 days from the time of this post. I sold the 4300 strike, and then bought 1 4400 contract, and 1 of the 4500 contracts to the upside.

The spread was opened for a net credit of $37.25 on 28 November 2014. The total risk on this trade at expiration is about $6275. The margin required to post the trade is $10K. My profit goal on this trade is $17.25 or 17.25% of the margin.

I have a limit order to close the spread for $20.00. My ideal outcome would be a decline in NDX that would allow me to close the trade in a short period of time. My worst case scenario is a slow grind higher that will drown me in the "sea of death" to the upside.

As for the currency world, I went long the USD/CAD a couple of days ago, because it was the only pair on my platform that looked like a reasonable setup.


I entered long in the direction of the trend near the 200 period MA on a 4H chart, and OPEC did the rest.

Please post any questions or comments you may have. Apologies to Nicole from Thailand for taking 8 months to get back to her. I'm not on a ship anymore. :)

STT

Friday, March 7, 2014

Swing trading Forex

Hello Traders,

I haven't posted in a while, but I just wanted to share some of the winners I have had in the last couple of months in Forex. I have a bunch of pictures of the before and after that are pretty much self explanatory.

My current system is very simple and only uses two indicators on a 4 hour chart.
  1. A 200 period Simple Moving Average.
  2. Parabolic SAR on the standard setting
First is a long AUS/USD trade that I took after noting in early February that price action had pierced the 200SMA and held. I watched for about a month as price action held above the 200SMA for the last 30 days causing it to rise. Then, noting in March that the price action touched the rising 200SMA, and the PSAR showed a green dot, I decided to take a shot. Long AUD/USD 2 lots, with T1 at +70 pips, and T2 at +140 pips.


For the Aussie trade above, I moved the stops to breakeven shortly before the first target was hit, and was lucky enough to have the second target close at .9100 the next day.

The next trade is a short EUR/USD trade that I took because the Euro had broken down through the 200SMA on the 4 hour chart and failed a further test of the Moving average making a lower low. I watched as Euro struggled along the moving average, but when price action moved below the wick of the lowest candle of the previous three days, I pulled the trigger.

 
After the first target was hit the stops were moved to breakeven.

 
Then, after a small retracement, there was continued momentum to the downside, so I moved the stop for the second lot to the top of the retracement.


On this one price action returned and was stopped out for about 50 pips above breakeven on the second lot.

If you want to talk swing trading or have any questions become a follower of the Small Time Trader. In the near future, I'll post some of my latest options trades. Some winners, some not, but I'm always learning.

Follow me on Twitter @ B50cal1978

I try to post everything real time as far as currency trades go, if you want to see what I'm looking at.

Good luck trading,
STT

Thursday, January 2, 2014

Kiwis are a short bird

Hello traders,

Just wanted to post about something that doesn't happen as often as it should to me: A successful trade!

Most of my successful trades in currencies have happened using a 4 hour chart with the 200 period MA as a trend filter. Simple right?

I have actually found that the less indicators I use, the more successful trades I have ended up bagging.

Here's the setup for my short NZD/USD trade:


I noticed that the 200 period moving average has shown that the NZD though with some volatility has been trending downward, making lower highs and lower lows. I decided to enter when after testing the 200 MA price action dropped below, and a red candle followed in the next four hour period. When this first red candle closed (2AM EST) I went short 2 lots. T1 was based on risk of 30 pips for the first lot, and T2 was 60 pips or twice the risk.


After T1 was hit (5:47 AM EST) the stop on the second lot was moved to break even.


T2 followed shortly thereafter (6:07AM EST) for 90 total pips.

I don't normally go short high interest currencies, but I decided to hop on this setup, and I'm glad I did.

Good luck trading in the new year,
STT