Saturday, March 21, 2015

What if GOOGL goes nowhere?!

Hello Traders,

I hope everybody is having as good a weekend as I am. I've been super busy during the work week, but I have still been able to get a few trades going in a couple of diversified strategies. I have been trading a mix of debit spreads, short puts, credit spreads and one trade that I will detail below, the Double Diagonal. I had honestly intended for this post to be more timely, but work is work, life is life. I'm in Guam, and I work during the day, so the market opens at 2300 and closes at 0600. Gotta get my beauty sleep.

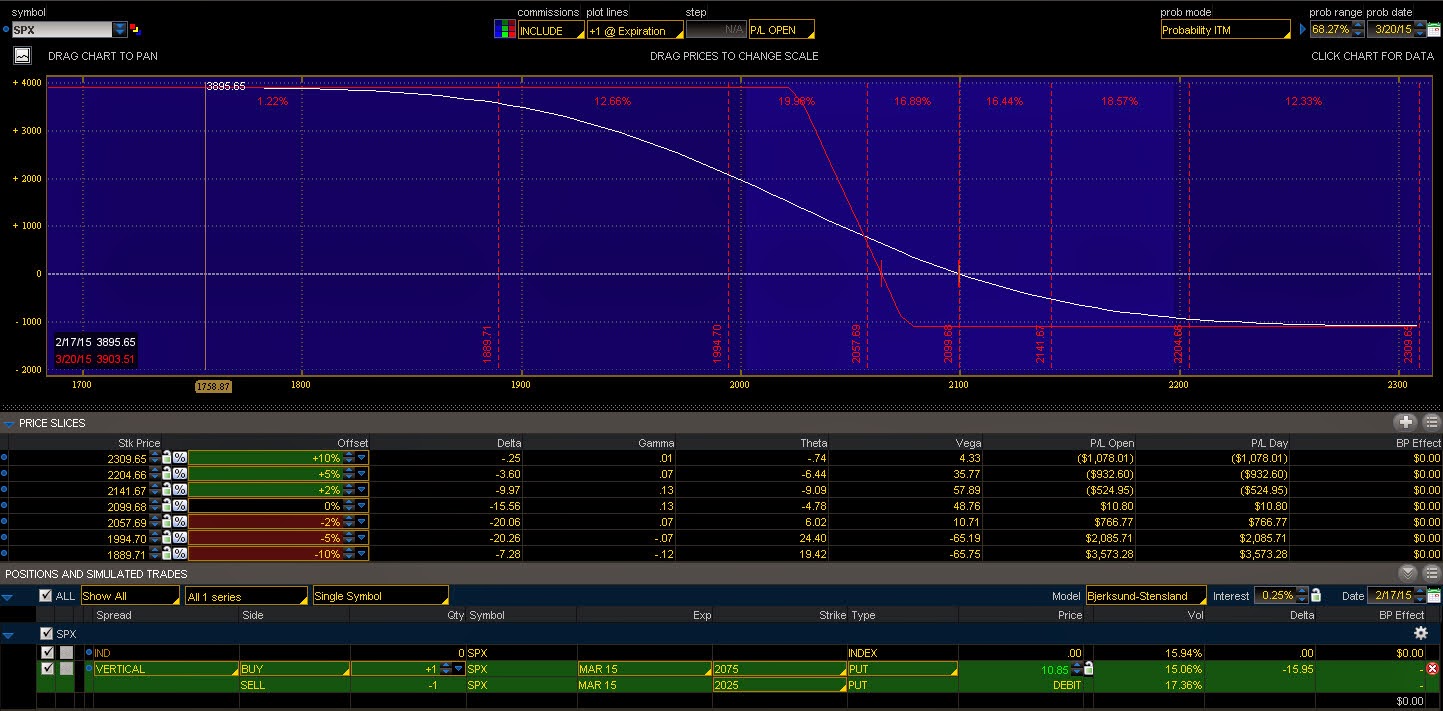
Anyway, Here's the chart of GOOGL as of 20 March 2015, showing the upper and lower break even points for the Double Diagonal placed as described later in the article.


And here's how I put together the trade:


My April '15/May '15 615/635c525/505p Double Diagonal was placed on 6 March 2015 for a $.75 credit. My normal target for a trade like this would be 10% on the capital at risk, or $200 per 1 contract on the trade as placed above. However, I currently have a limit order to close the trade at $2.25 net credit, or 7.5% on risk capital or $150 per 1 contract. I'm taking less than normal in an effort to exit the trade as soon as possible.
 
My last 2 Diagonals, one in RUT and one in PCLN were closed for 10% gain on capital after about 25 days and much sweat. I would love to be in GOOGL for less than 20 days just to increase my probability of profit.
 
Here's the trade as it sits now:
 
 
The trade sitting at about $110 per contract profit now. I expect by the end of this coming week to be able to close for my 7.5% on risk target. The current Theta is $9, so if volatility does not decrease by more than 1%, I should be out on Thursday. If the implied volatility in GOOGL increases it will be sooner as the Vega is $15.
 
Ok, how did I come upon this trade you might ask? I use these Double Diagonals on names that I would normally trade for a volatility crush on earnings with an Iron Condor. Implied volatility has a tendency to ramp in these names in the month prior to earnings as actual volatility decreases, as the stock will sometimes move less in anticipation of the coming earnings announcement.
 
So, since the Double Diagonal is a long Vega, or in other words a trade that benefits from an increase in implied volatility, I wait until about 5 or 6 weeks prior to earnings, and set the short strikes about 45 days out, with the long strikes on the next monthly cycle after the month in which the short strikes are placed.
 
The best range of implied volatility to put this trade on is between 20-25%. If the security that you choose is much lower than that, the short strikes will be too close together and your probability of profit will fall through the floor. The idea is to trap price action in between your short strikes as implied volatility ramps up though 30% while movement on the tape slows or virtually stops as the earnings announcement approaches.
 
One more thing. It does not matter whether the Double Diagonal is placed as a debit or a credit. The only thing that matters is that the profile of the trade looks as it does in the example above. Your max profit line at expiration must not drop below the zero line. Your short strikes should be close to 1 standard deviation in the short strike month.
 
I have successfully placed these trades in CMG, PCLN and GOOG (before the split). I have not had the time, but I am interested in backtesting the strategy on FB, TWTR and TSLA as they have very similar volatility profiles surrounding earnings and during the period in between.
 
Check out the Small Time Trader Facebook for the latest from those who have most influenced my trading.
 
If you have any questions, place them in the comments below, so everybody can see the exchange.
 
Good Luck trading in the next week and beyond!
STT


Saturday, March 7, 2015

Is your system working?

Hello Traders,

One of the biggest mistakes that new traders make (I am included in this) when they begin trading is to find the one system to take all of the work out of trading, and have a simple money machine that is profitable and just let it run. When that doesn't happen over the first week or month, they will jump to the next system and the next as their account draws down to nothing.

What if you're a mid-level trader with some experience and your system that's been profitable for months goes 0 for 5, or 0 for 10 over a given period. This can cause one to question their entries, executions and indicators for one. It can also get one to question themselves which can be bad for confidence and continued profitability. I have heard the expression "If it ain't broke, don't fix it."

But what if it is broken. What if general market conditions change. Market conditions do change. Just like the weather. Markets can change in terms of trend, volatility and liquidity just to name a few.

While not wanting to fall into the trap of jumping ship on my system every time it doesn't work, I also believe in a concept that I have heard referred to as CIP, or continuous process improvement.

I am an aviation enthusiast, and one of the parallels between aviation and trading is that the indicators you choose, and how you have them set up is to the market how instruments in an aircraft are to a pilot. Back in the 20's and 30's radios became more a part of how aircraft were navigated from one point to another. Over time these systems improve, and with them the accuracy of navigation.

Over the last year or so, I've traded my favorite pairs on strictly a 4 hour chart, using the 200 period SMA as my trend filter, and Parabolic SAR as my entry signal. So in 2014, I was able to get my micro forex account from about $200 to about $310. Over the first two months in 2015, though I could have made better choices in my system, using my standard stops and entries, I experienced a drawdown back to $200, all while going 0 for 10. 10 straight losses. So I figured that it was time to rethink how I navigate the market.

My new system for 2015 is as follows:

  • Multiple time frame analysis instead of trading only on the 4 hour chart for simplicity. I look at Daily for the trend, 4H to look at impending signals, and 1H to enter the trade.
  • I felt that I needed to reduce noise in the trends that I was following, and using Heiken-Ashi candlesticks accomplishes this.
  • I was getting whipsawed in my entries using PSAR, so I switched to a MACD with the most basic settings to provide entry signals.
  • I use the most recent structural highs or lows for stops, and set my targets to twice that number in pips for a 2:1 reward to risk ratio. When I get halfway to the target, my stop is moved to breakeven.
Here are some examples of how it looks:


In addition to the rules above, I put in place a rule to counter one of the most frustrating experiences in forex that I'm sure I'm not alone in experiencing. I've done my analysis. I've reviewed the calendar for risk events. I'm going in the direction of the trend and all my signals in all of my time frames line up. And I just got stopped out for 50 pips literally one hour after placing the trade.
 
So from now on, I harbor no love for any direction. If I get stopped out in the same 4 hour bar as the trade is placed, I will immediately place a reverse trade on in the direction of the stop out using structure to define the new stop, and 2:1 reward to risk as the new target. The reason is that regardless of my analysis, I was clearly wrong. And I have no problem letting the market that just stopped me out provide me some positive pips to reduce my loss, as the market has just informed me of it's true direction. In the last month, this has worked more often then not allowing me to fight losing trades back to even.
 
The reason I wrote this is to have my own rules visible at a glance for the near term, but also if any of you that read this get something out of it, it is worth the time. If something is broke, identify it and make a correction. Instead of 10 losses in a row, I am profitable over the last two weeks, due to one good medium term trade, and I am fighting back to even with a good mix of wins and losses that I feel that I can improve.


Drop a line in the comment block below, and we'll have a conversation. The system above is my own way I look at the markets, not a recommendation by any stretch. But if you have any questions on how I use the above indicators to find entries, let's talk it out.
 
Checkout the Small Time Trader Facebook for the latest from those who have most influenced my trading adventure.
 
Good Luck in the week ahead,
STT

Thursday, February 26, 2015

Flattening of Emotions AUD/USD

Hello Traders!

I haven't posted a currency trade in a while, so here's what I have going on...

I just went long the Aussie against the US dollar at about .7873.

I had been looking for weakness and a break below .7835, and was in fact short before the London open. When I saw that I was clearly wrong directionally on the break to the upside at .7860, I reversed fields, positioning for a break above .79 on anticipated continuing upward momentum.


So, long AUD/USD at .7873, stop is .7835 and limit is 80.0.
 
 
I posted this trade as noteworthy because I find that I am notorious for digging in my heels based on what I want instead of clearly taking in what the market is trying to show me. Even if the trade fails later due to market conditions, I feel as if it is a victory to disconnect from what I feel should be and trade what I see.
 
Check out the Small Time Trader Facebook for the latest on those who influence my trading the most.
 
Leave a comment if you find the content interesting. Don't forget to share, and +1!
 
Good luck in your own trades!
STT
 
P.S. I had to add that I was able to close the long for a modest 8 pips as AUD/USD reversed again!
 
 
Here's to staying nimble! I was intending to catch a rise in Aussie on low vol in complacent markets. Perhaps I should have written about my short EUR/GBP trade. More on that later...


Thursday, February 19, 2015

2015 in Full Swing! SPY SPX GLD TLT

Good Morning Traders!

I've been busy with work and other things, and have not been able to post as I trade. I've got a couple of minutes before I grab some sleep to catch up on a few things for those of you that are interested. I also like to post to organize my thoughts a little, and later to be able to take a big picture view of the portfolio and the trades as a whole. This usually ends up as: "What the !@#$ was I thinking!". But every once in a while I make some money.

So, When the VIX was last at 20 just before Feb '15 expiration, I sold a 2 standard deviation strangle in SPY for $.65 net credit about 55 days to March 31q '15 expiration at 217c/167p.


I was kicking myself the next day, as the trade could be sold for $.80, but now after a couple of weeks I'm back to even at about $.67. As you can see by the above charts, I was able to get a pretty fair credit, and my short strikes literally don't even show on the chart. I am most in danger (As I always have been, and probably always will be) on the call side. The S&P 500 has had a propensity at times to grind inexorably higher regardless of market fundamentals sometimes for weeks, slowly but surely running over call strikes like lava from that volcano on the Big Island in Hawaii that overran that unfortunate town. On this trade, I'm still in the game.

In my previous post on the S&P 500, I had purchased a butterfly below market hoping to capitalize on continuing volatility that never materialized. What a surprise. I was going to roll right in to March expiration with the same butterfly the next day, but I got cold feet and thought; One, the market is going higher from here, and I don't want my butterfly left out in the cold. Two, I thought that there might be a better way to manage my directional exposure based on my TLT butterfly. More on that later. I held off on my March butterfly until last night.

To maximize my Theta in the middle of the butterfly, I decided to leg in. I bought to open the SPX March 20 '15 2075/2025 put debit spread for $11.00. I did this because volatility is lower than it has been in the whole of 2015. Also, if I'm successful, and the SPX trades towards the 2025 level in the next week or so, I can get a lot more credit for the lower half of the put butterfly, and could possibly lock in a profit, and take risk completely off the table. If we bounce off the 50 day MA when/if there is a decline I may decide to close for whatever profit there is at the time, sans butterfly.


In my previous post on GLD, I had gone long with a Sep'15 call at 122, reducing my basis on the call by selling the 122/112 Sep '15 put spread.


As you can see, my entry was horribly mistimed. Though because duration is my friend on this one, and I am still above trend as GLD looks to be putting in a higher low, this is in the danger zone for the following reasons. I can be put 100 shares of GLD per short contract at 122 at any time. GLD can very likely continue lower. I am close to stopping myself out on this one, as I can still salvage 50% of my capital. On the positive side, 7 out of 10 of the days that GLD traded above 10 million shares after gapping up from 119 were on green days as GLD works to build a higher low after this pretty convincing rejection from 125.

In my previous post on TLT, I discussed how my would be victory spread was blown up by having been exercised on short calls that were In The Money when TLT peaked at 138. Though not a revenge trade, I went back into TLT as soon as I could short at 135 with a long put, because my thesis had not changed. If TLT is extremely overbought at 135, it was even more so at 138. Anyway, being in hind sight correct about the direction of TLT, and having a nice profit on my long 135 put, I turned my exposure to a butterfly to take advantage of the elevated volatility in TLT to sell some premium.


I'm sitting pretty with the TLT butterfly having locked in $1.69. I would love for TLT to rise in the next couple of days to the 130 level. I have a limit order to sell at 1.65 net credit, or double per contract over my locked in profit, of which I have no doubt will be filled if TLT can rise above 130 again.

In closing, I'm net short stocks, neutral to bullish Bonds and long gold.

Wow! That's quite a bit to catch up on, but there's where I stand going in to March. I'm working hard to recover from my OVX fiasco, which were two big complete 100% losers caused by trading in a product that had no liquidity in an underlying that I have very little knowledge of, going through it's most INSANE period in the better part of a decade. Lesson learned.

Good luck in your own trading, and please leave comments or questions here or on the Small Time Trader Facebook.

STT

Saturday, February 7, 2015

Taking advantage of overbought bonds. TLT

Good Morning Traders!

Last week I got exercised on some calls that I had sold short as part of a spread in the TLT on a thesis that bonds were overbought and would soon be coming down to earth. The particular structure I had chosen was a 50/50 bet as far as probability of profit, which based on the extreme overbought levels was a risk I wanted to take. That position would have been profitable again at the end of last week, but no regrets. I must move on.

I still felt the same way when I was covering the TLT shares that I was assigned last week, but I didn't want to expose myself to the level of risk as my last "victory spread". I still have no idea why they call it that. Anyway, I decided to dip my toe back in by going long the March '15 monthly TLT 135 put for $3.00 net debit, when the TLT was about 135. I entered this net debit with the following plan for exit and/or expansion. I put in an alert for TLT at 138 on the high side, and 131 on the low side. The 138 alert, which would've been my stop, as the short term decline would've been invalidated by the rise of TLT above 138. And the 131 alert which would be my catalyst too turn my long TLT 135 puts into a butterfly, and locking a profit into the trade.


I was fortunate enough to get TLT close enough to 131 after the release of the Friday jobs number to sell the 131/127 Mar '15 put 2:1 ratio spread for 4.69 credit.

What that means is that I now have the 135/131/127 TLT Mar '15 put Butterfly on for a $1.69 credit which is also my max risk.


 In other words, baring any early exercise/assignment of any of the options involved in the spread, I will make at least $1.69 credit no matter what TLT does.

I will update this trade on the Small Time Trader Facebook.

Feel free to drop comments or questions. I love a good conversation. Let me know what works for You!

Good Luck trading!
STT

Thursday, January 29, 2015

Time to let it shine! GLD

Good morning traders!,

Over the last year as the US Dollar began it's massive run, the myriad of Gold related products has been generally out of favor as the performance of these products has been poor. 2015 is a year of change. There are rotations in many asset classes, and price extremes in a few. One of the things I have noticed on my own charts is how well Gold has been performing in 2015.

 
Above is a simple chart showing the relative performance this year of the GLD ETF versus the S&P 500 index. With the SPX down about 3% and GLD up about 5% I have hatched a plan for long exposure to gold upside with limited risk to the downside.


Back on 15 January, I noticed a large increase in GLD trading volume on the breakout of the 120 level, which was also the level of the 200 day SMA. Obviously charts don't guarantee anything, but every once in awhile I like to think that I see a bread crumb or two left by a group of traders or institutions that move a whole lot more money than I do. After that 120 breakout to the upside, momentum drove the GLD to 125. I was tempted to chase (unfortunately I always am), but this time I figured that GLD would roll back a little and give me the entry I was looking for. Today it has.

So here's how I'm exposing myself to GLD upside for 6 months above the 122 level:


The easiest way to explain this is by saying I sold a put credit spread lower the cost of a long call. I sold the 122/112 Sep '15 GLD put spread to buy the Sep '15 122 call, all for $3.05 net debit. So, I have unlimited (theoretically) profits to the upside, but I'll probably put a limit order to sell at $20.00 and check on it in a couple of months. My max risk at expiration is $13.05, which is the distance of the put spread plus the net debit for the upside call. My near term risk is contained somewhat by the premium contained in the structure of the spread.

I'm giving myself a lot of time to be right on this one. What I'm looking for is a breakout above the 125 level, and hopefully a higher high around 135 or 140 on sustained momentum. If January is any indication of how gold will perform in 2015 as the US dollar rises, I think I will be find.

Happy to join all of you gold bugs in 2015.

I will update this trade here and on Twitter @B50cal1978

Checkout the Small Time Trader Facebook for  more content from me and my influences in trading.

Good Luck Trading!

STT

Tuesday, January 27, 2015

Currency Headwinds. SPX

Good Morning Traders,

After 2013 and 2014, I developed a sense of the market that served me well in that environment. 2015 is whole new ball game. I'm finding myself having to unwind a couple of positions in assets that in this environment, I want no part of. I also find that I am a little too short volatility for the current environment.

Some of the latest earnings reports for companies that are sensitive to slowing world economies and lower energy prices have reported major currency headwinds, and some have revised down earnings estimates for the whole of 2015. As good as Apple is, I don't think that one name can float a ship that may be taking on a little bit of water moving forward.

VIX generally averaged about 14 in 2014, now that average is higher. I am planning to hedge my short term exposure to VIX by entering an OTM put butterfly in the SPX. The debit I am incurring to hedge my short VIX is about 25% of that position. The OTM butterfly also has a chance to fully balance the VIX position if I can get 300% of the initial debit.


My Butterfly is 100 points wide, so I have a pretty large potential profit area  to the down side. I am buying one Feb 2025 put, selling two of the 1975's and buying one of the 1925's. The first long strike of the Butterfly is near current prices, and the short strikes are centered on the 200 day SMA which I believe price action may be seeking.


I was filled at a $6.50 net debit, and I put in a limit order for a 19.5 credit, but I will close on a touch of 1975 no matter the price.

I will update this trade here and on Twitter @B50cal1978

Leave questions or comments! I enjoy a good conversation.

Good luck trading!
STT

Friday, January 23, 2015

Swiss Franc Fallout. FXCM Risk Reversal

Good Morning Traders,

The Swiss Nation Bank (SNB) threw the world for a loop the other day when they took off their Euro Currency peg. There were many individual investors that were completely wiped out due to the way that Forex leverage works in the retail market. Forex leverage for retail trading is often as high as 50:1, meaning that you can move a notional value of $10000 buy putting up just $200 in margin. Pretty dangerous if you're involved in currencies that are artificially pegged to other currencies that are manipulated. Wow.

Anyway, other entities that were damaged by the SNB were Forex brokers that serviced those retail customers. One of these was my own Forex Broker FXCM. When I first began trading currencies, I went with FXCM because of all of their educational content, and their focus on conservative capital management and risk controls. It seems that they practice what they preach. While many Forex brokers around the world were instantly insolvent, FXCM was able to secure a cash lifeline and continue operations as normal, albeit with significantly more debt than they had before.

So what happens to the common stock of a company that takes a $200 million loss in one day? The stock trades down to $1.28 a share in two days. What happens to the same stock when the company is not insolvent? The share value doubles in two days.


While I believe that the shares are pretty accurately priced given the damage to the company, I am also confident that management will continue to operate in a profitable way, and that the financial health of the company will increase as time goes on. I want to be long FXCM.

Based on the recent acute decline in prices of FXCM common stock, The puts have a ton of premium that I want to take advantage of. I was delighted to find that FXCM has options trading out to August of 2015 from 1 to 5 dollar strikes and higher, and the open interest and volume are making for very tight spreads.

As a replacement for going long common stock, I intend to go long FXCM using a spread called a risk reversal. Obviously I intend to profit from this trade sooner than August, but I often use duration as risk management tool. Even if I get put the stock for $2.50, my thesis isn't going to change long term, and the price of the stock is so low, I can't loose much as this is a small position in my portfolio. I just want to take advantage of a perceived opportunity.


I am selling the August '15 $2.50 puts to pay for August '15 $5 calls. I am looking for $.25 net credit per contract. My max loss is the same $2.50 that I could be put for each contract at or before August expiration. There is no cash outlay for this trade, only the margin covering the cost of the short puts.

I will update this trade here and on twitter @B50cal1978

Please drop any comments or questions you may have, as I love a good conversation.

Good luck trading!

STT

Sunday, January 18, 2015

Aren't Bonds Supposed to Yield Something? TLT

Good Morning Traders,

Over the last couple of months I have been keeping an eye on TLT, the 20+ year bond ETF made to track the face value price of bonds in that particular index. The index, by virtue of trading on the price of the bonds is inverse to the direction of the yield percentage of the bond index.


I had originally been following TLT in an effort to find the best place to enter with the trend to the up side as bond yields to continued to fall. I was intending to place something like a covered call, but by using options, and going out 2 or 3 months. Now, after this parabolic run, I see more risk to the downside than to the upside as far as TLT price is concerned, and I want to play it for a short term pullback.


I wanted to get a lot of profit potential for not a lot of margin put up, so I did a back spread whereby I sold the TLT Feb '20 2015 130 calls, and bought the 135 and 141 calls in equal amounts. Most back spreads are 2 to 1 strikes bought to strikes sold. The reason that I spread the ratio to the upside is to reduce the total risk and thus the margin required for the trade. My breakeven at expiration is 131.86. My max credit on the trade is $1.86 per contract, and the max loss is $3.13.

I plan to close the trade at 50% of max profit or about $.95 per contract. As I type, this price level is 128.45, and will climb a little closer to the 130 level each day due to theta, or depreciation that will occur because of the passage of time. With any luck, I plan to be out of the trade in 7 to 10 days.

I will update here and on Twitter @B50cal1978

Follow my blog if you enjoy the content. As always drop any comments, or questions you may have. Let me know what you think of the trades, strategies and anything else that I can do to make the Small Time Trading blog better.

Good Luck to everybody in the coming week!
STT

Monday, January 12, 2015

Would you like some Guacamole with that? CMG

Good morning traders,

While most of my trading is done on index options, every so often I find a stock that piques my interest in which to place a trade. Chipotle (CMG) caught my eye late last week as the implied volatility for at the money options exceeded 40% for the February 18 2015 normal monthly expiration cycle. With Chipotle this is usually the case in the couple of weeks before earnings.


Above chart shows how the current implied volatility stacks up with 6 month historical volatility. While the volatility could still rise, I believe the options are priced by the market makers for movements relating to the upcoming earnings report, and that 40 to 45% is what we'll see until the report is released.

On Friday, 9 Jan 2015 I was filled at $5.85 net credit for the 825/875 call, 600/550 put Iron Condor for Feb 18 2015 expiration in CMG.


From trading CMG in the past, I've seen that after spikes or drops in price action that CMG's price seems to chop for little while until the next big event. For me, I see the next big event as the February earnings report that takes place on 3 February 2015.

Some will ask, "Aren't you afraid of the gap up or down when earnings are released?!"

This I will answer a resounding "Not at all."

Here's how I'm building my burrito:


I intend to close the trade at 50% of max profit or $275. The Analyze tab pic above has been fast forwarded the 3rd of Feb. Just due to Theta,  and with volatility staying in the region of 40 to 45%, CMG can be any where between the price levels of 665 or 750 to achieve this. At any time I can pull $275 out of the trade, it will be closed by limit order. On Monday, 2 Feb 2015, I will be closing the trade regardless of position to avoid the earnings gap. Yes, I'll have Guacamole with that.

I will update this trade here and on Twitter @B50cal1978

Don't be afraid to check out my sponsors, follow the blog or leave a comment or question. I thirst for engagement and love a good conversation!

As always, Good Luck!

STT

Friday, January 9, 2015

Getting the Cable turned back on. GBP/USD

Good Morning Traders,

Lately I've been posting a lot about options and trading volatility as it's own asset class. Today, I'm going to get the cable turned back on.

The US dollar has been on a mammoth run against nearly every other asset that it's paired against, and some have done better than others. On a relative basis the British Pound has held up pretty good. When I was going through my charts today looking for setups, I happened upon an idea.


What we have here is a chart of GBP/USD going back about 18 months. After the last two days price action I decided to take a look back. In July of 2013, Cable did a double bounce off of support at 1.48. I don't often take counter trend trades, but the 1.48 level seemed like an important enough level for me that I thought I would take this trade. In addition, the BOE held rates at .5% instead of cutting.

My thesis is that the 1.48 to 1.50 level will create sufficient support to cause a bounce created by capitulation selling and retest the 1.54/1.55 level.

I'm long GBP/USD @ 1.51. My stop is 1.48, the 18 month low off of which there was a double bounce. My limit is 1.55. I will move the stop to break even at 1.53, and trail at 200 pips.

As always, follow the Small Time Trader blog should you so choose.

I will update this trade here and on Twitter @B50cal1978

Thanks to my Google+ circles for my first 100 views in a day post.

Good luck trading!

STT

Wednesday, January 7, 2015

Has Crude Oil Volatility Peaked?

Hello Traders,

Oil has Implied Volatility?

Most people that trade options successfully use some form of implied volatility measurement to make decisions about the trades that they want to make. I know implied volatility is almost always the first thing that I look at when I'm evaluation a potential trade.


As crude oil continued to decline below 70, and then below 60 I found myself thinking that I had missed the boat on being short oil. There is no real way to tell when the snap back will be, and with the implied volatility of the USO at a 5 year high, I have been using OVX to exercise my opinion on the movement of Crude oil. OVX is an index that uses the current VIX methodology as applied to the USO options chain. OVX options are European style, just like VIX and cannot be exercised early.


In last night's price action I noticed something curious. USO was down more than 4.5% but the price of OVX declined. Not that I'm any good at calling tops, but my opinion is that the downward velocity of USO price action is not surprising market participants any more, and that they are positioned for that velocity and that panic has peaked. My thesis is that even if USO falls further, that volatility as priced by OVX will roll off over the coming months.

I went out to February to give myself time to be right. I sold the 50 calls and bought the 55's to make a simple risk defined credit spread. I got about 25% the width of the $5 strike separation, or $1.25 credit.

I plan on using OVX quite a bit if successful with this credit spread. Perhaps by using ratio spreads or Broken wing Butterflies. I see a ton of potential for mean reversion income trades as these are once in 5 year levels in OVX. I will update here and on Twitter @B50cal1978

Please leave a comment or question if you have one. Feel free to follow the Small Time Trader blog and be sure to check out my sponsors if what they offer is what you're looking for.

Good Luck!

STT

Monday, January 5, 2015

Volatility Minefield! VIX

Hello Traders,

In 2013 and 2014 the low price of VIX and the relentless march higher in the indexes made it difficult if you wanted to sell credit as a regular income strategy. The first couple trading days in 2015 have provided an interesting level of volatility in a number of asset classes, raising some interesting trade possibilities. Oil Volatility as shown in OVX has reached and is holding levels not seen since 2009. Gold Volatility as measured by GVZ is above 20. And as I type, VIX which measures the level of volatility in the SPX index is also over 20.


I intend to fade VIX into January expiration. I've done this by selling an Unbalanced Iron Butterfly as shown in the below picture. I sold the 19 put and bought the 18 put, while selling the 19 call and buying the 27 call.


This is an income trade. My thesis is that VIX will settle below 20 on January expiration. I received $1.95 credit for the trade which I will be able to keep all of below 19.92 VIX January settlement. Expiration break even is 20.95. If VIX happens to settle right at 19, I will receive an additional $1.90 credit. Max risk is $6.05 above VIX 27 at January settlement.

Follow the Small Time Trader blog if you're so inclined.

I'll update the status of my trades here, and on twitter @B50cal1978

Leave comments and questions. Tell me what trades you all have in the works.

Good Luck in the NewYear!

STT